

The U.S. census population schedules provide a glimpse into the Asian American population over time. As is so often the case, the questions asked and statistics gathered do not necessarily reflect all of the questions that we have today.
The federal government began asking questions about citizenship and countries of origin beginning with the fourth U.S. census in 1820. In 1820 and 1830, those who were counted were merely asked about citizenship. As immigration increased towards the end of the 19th century, so did the questions, which came to include place of birth, parents’ places of birth, language spoken, and, in the mid-20th century, past residence.

Chart showing data points recorded in the U.S. census over time
Eventually, these questions took on great significance. On 26 May 1924, the federal government developed a quota system for immigration (43 Stat. 153). The law stated that “The annual quota of any nationality shall be 2 per centum of the number of foreign-born individuals of such nationality resident in continental United States as determined by the United States census of 1890, but the minimum quota of any nationality shall be 100.” “Non-quota immigrants”—those who did not need to adhere to the quota system—included those who were born in Canada, Newfoundland, Mexico, Cuba, Haiti, the Dominican Republic, the Canal Zone, Central America, and South America; spouses and children; and certain occupations. Consequently, the ethnic groups who immigrated in more recent times—and who were continuing to come in great numbers at that time—were extremely limited. This included individuals from Eastern and Southern Europe, the Middle East, and Asia.1
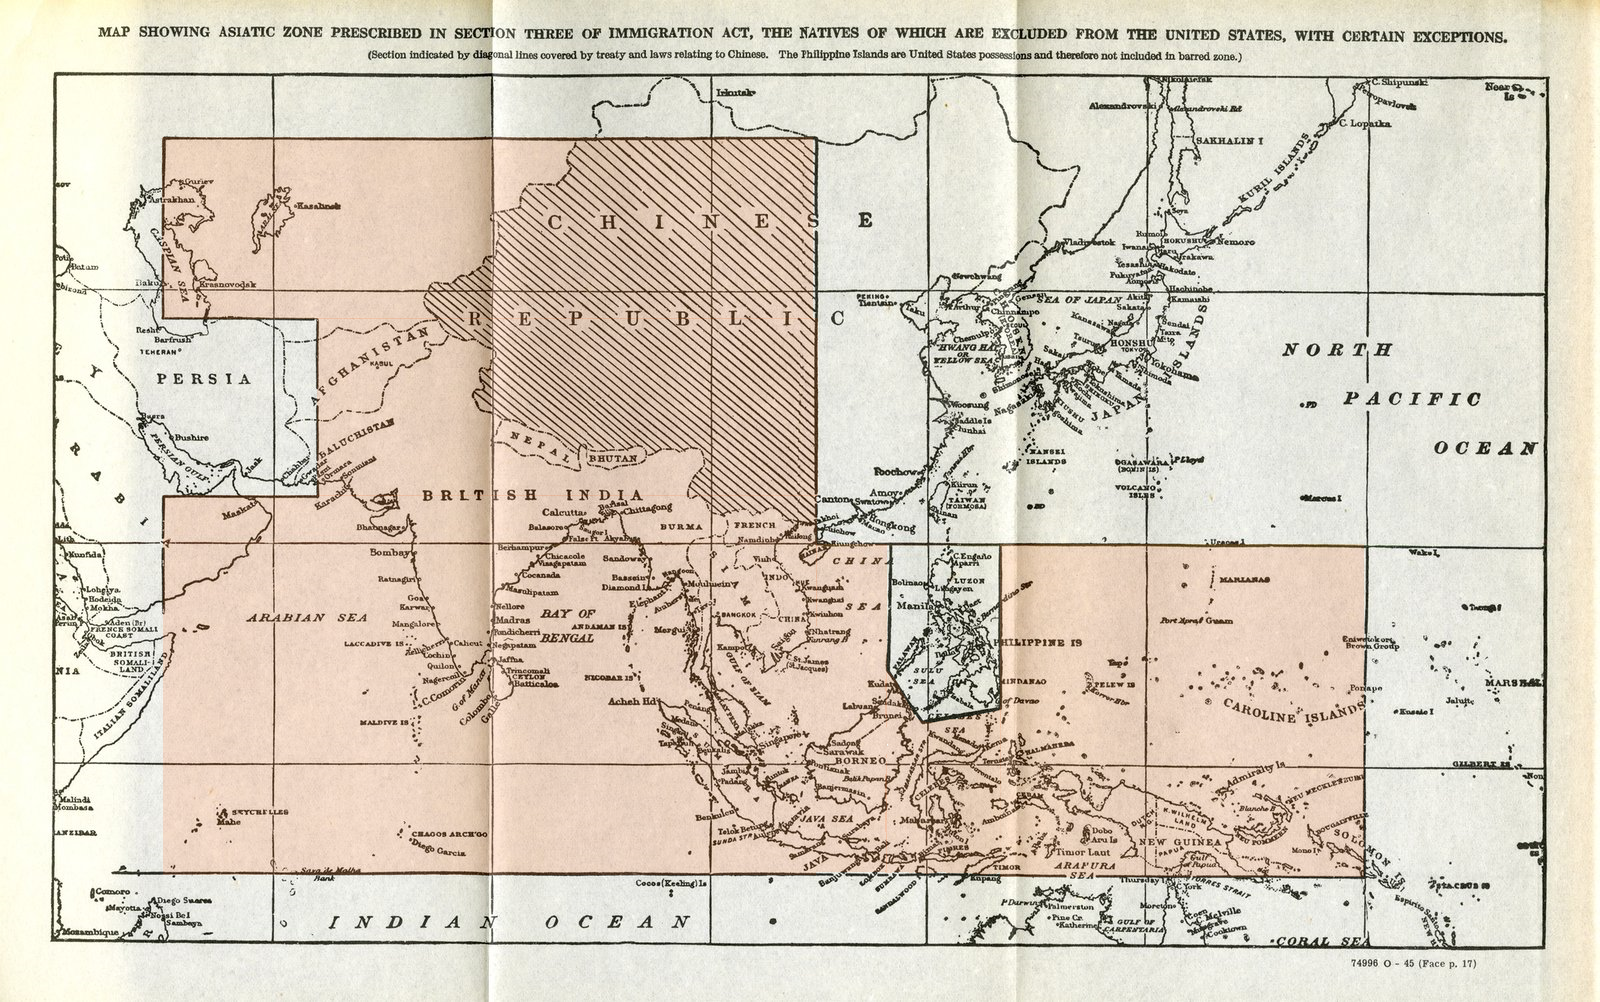
Individuals from Asia already had restrictions placed on them. On 6 May 1882, the Chinese Exclusion Act (22 Stat. 58) placed restrictions on Chinese laborers, and individuals from China were barred from citizenship. The Chinese Exclusion Act was not repealed until 17 December 1943 (57 Stat. 600). On 5 February 1917 (39 Stat. 874), the Asiatic Barred Zone was created, which meant that residents of Asia who were not natives of islands possessed by the United States could not enter the United States unless they were members of an exempt profession or spouses or children of those who were exempt.2

Map of the Asiatic Barred Zone
``Hearing before a Subcommittee of the Committee on Immigration, United States Senate, Seventy-Ninth Congress, First Session, on S. 236: A Bill to Permit All People from India Residing in the United States to be Naturalized, April 26, 1945. ``Washington, DC: United States Government Printing Office, 1945. (Color added by Jessi Bennett)
The quota system was refined over time. The Displaced Persons Act of 25 June 1948 (62 Stat. 1009) specified that from 30 June 1948 to 1 July 1950, “50 per centum of the German and Austrian quotas shall be available exclusively to persons of German ethnic origin who were born in Poland, Czechoslovakia, Hungary, Romania or Yugoslavia and who, on the effective date of this Act reside in Germany or Austria.” The Immigration and Nationality Act of 27 June 1952 (66 Stat. 163) changed the quota system to be one-sixth of 1% of a nationality’s population in the continental U.S. in 1920, with a minimum quota of 100. This skewed quotas to favor those who were already well-represented in the U.S. Those who were born in Canada, Mexico, Cuba, Haiti, the Dominican Republic, the Canal Zone, Central America, or South America, or the spouse or child of that immigrant are considered to be “nonquota immigrants.” Immigrants who had at least half of their ancestry from the Asian-Pacific triangle are considered to be from that area even if born elsewhere, and the quota was set at a maximum of 2,000 for the Asian-Pacific triangle. Within quotas, immigration preferences were based on skillsets and family. Not until the Immigration and Nationality Act of 3 October 1965 (79 Stat. 911) was the quota system abolished.3
The official statistics that were derived from census data provided little information on Asian American Pacific Islander Desi Americans until recent times. Today, the Asian Pacific Institute on Gender-Based Violence defines regional ethnic groupings as:
- Central Asians Afghani, Armenian, Azerbaijani, Georgians, Kazakh, Kyrgyz, Mongolian, Tajik, Turkmen, Uzbek
- East Asians Chinese, Japanese, Korean, Okinawan, Taiwanese, Tibetan
- Native Hawaiians and Pacific Islanders (in the United States Jurisdictions & Territories) Carolinian, Chamorro, Chuukese, Fijian, Guamanian, Hawaiian, Kosraean, Marshallesse, Native Hawaiian, Niuean, Palauan, Pohnpeian, Samoan, Tokelauan, Tongan, Yapese
- Southeast Asians Bruneian, Burmese, Cambodian, Filipino, Hmong, Indonesian, Laotian, Malaysian, Mien, Papua New Guinean, Singaporean, Timorese, Thai, Vietnamese
- South Asians Bangladeshi, Bhutanese, Indian, Maldivians, Nepali, Pakistani, Sri Lankan
- West Asians This is a contested term, as most people from the region do not self-identify as such. West Asia is typically referred to as the Middle East; and geographically includes the countries of Bahrain, Iran, Iraq, Israel, Jordan, Kuwait, Lebanon, Oman, Palestine, Qatar, Saudi Arabia, Syria, Turkey (straddles Europe and Asia), United Arab Emirates, and Yemen.
Since 1997, the U.S. Census Bureau has used the Federal Office of Management and Budget’s definition of Asian as “A person having origins in any of the original peoples of the Far East, Southeast Asia, or the Indian subcontinent including, for example, Cambodia, China, India, Japan, Korea, Malaysia, Pakistan, the Philippine Islands, Thailand, and Vietnam.” They define a Native Hawaiian or Other Pacific Islander as “A person having origins in any of the original peoples of Hawaii, Guam, Samoa, or other Pacific Islands.”5
Despite the great diversity and the importance of the quota system until 1965, official census statistics recorded only a fraction of these ethnicities specifically.6 For the most recent census to be released—1950—official statistics that were published in pamphlet form for individual cities (including Richmond and Norfolk, Virginia) truncate further what is known about Asian Pacific Islander Desi Americans, given that the focus was on white and nonwhite, which was occasionally divided into “Negro” and “other races.” Great care was taken to record the statistics for places of origin for those who were white, but no such care was taken for those who were classified as “nonwhite.”7 Thankfully, with the advent of databases such as Ancestry and FamilySearch, it is possible to search for ethnicities for which data is not revealed in official census statistics. Fortunately, the publications from the census have changed considerably since 1950. In 1990, 2000, and 2010, there are publications devoted specifically to the Asian and Pacific Islander populations within the United States that provide detailed statistics.

Chart showing ethnicities recorded by the U.S. census over time
Campbell Gibson and Kay Jung, “Historical Census Statistics on Population Totals by Race, 1790 to 1990, and by Hispanic Origin, 1970 to 1990, for the United States, Regions, Divisions, and States,” Population Division Working Paper No. 56, (Washington, DC: U.S. Census Bureau, September 2002). Available online: https://www.census.gov/content/dam/Census/library/working-papers/2002/demo/POP-twps0056.pdf.
The Census Bureau’s decision to provide few details on the United States’ Asian population paralleled the United States’ methods of tracking immigration to a certain extent, although it is possible to get a better idea of the countries from which individuals emigrated from immigration statistics.
The United States began tracking immigration from China and India in 1820, which is one year after the Steerage Act that required the creation of passenger lists for ships coming to the United States.8 Statistics for other countries are much less complete:
A few immigrants from Japan were recorded in 1861, 1866, and 1867, but complete records for Japan begin with 1869. Figures for Turkey in Asia are available since 1969. Data on some immigration from Arabia are recorded for 1876-1895; from Armenia for 1874-1895; and from Persia for 1871-1895. For 1896-1923, immigration from Asia included only China, India, Japan, Turkey in Asia, and “other Asia.” In 1924, Syria was added, and in 1925, Armenia, Palestine, and Persia (Iran) were added to the lists of Asian countries. Since 1934, Armenia has been included in Russia. In 1931, Siberia, or Asiatic Russia, was separated from European Russia, and Iraq and Siam (Thailand) were added to the lists. Since 1964, all the U.S.S.R. has been included in Europe.
In 1945, the classification of country in the country-of-birth statistics (on which the Quota Law was based) was adopted for the immigration statistics. This change resulted in the addition to the immigration lists of Afghanistan, Arabian Peninsula, Bhutan, Muscat, Nepal, Saudi Arabia, and Asiatic colonies, dependencies, and protectorates of European countries. Since 1948, the following countries have been added to the immigration lists: (1948) Burma, Ceylon, Jordan, Korea, and Pakistan; (1949) Israel (formerly included with Palestine), Lebanon (formerly included with Syria), and Yemen; (1950) Indonesia; (1952) Bonin Volcano Islands, Ryukyu Islands, Cambodia, Laos, and Vietnam; (1957) Formosa; (1961) Cyprus; (1963) Kuwait; (1964) Malaysia; (1967) Singapore.9
The earliest reports from 1820 to 1870 were from the State Department and may be found in Congressional House or Senate documents, depending on the year. The Bureau of Statistics published quarterly reports from 1867 to 1891. Beginning in 1892, the Bureau of Immigration began to report statistics. The agency changed names several times; it became the Bureau of Immigration in 1912 and the Immigration and Naturalization Service in 1932.10 In 2003, the Immigration and Naturalization Service was abolished, and U.S. Citizenship and Immigration Services, U.S. Immigration and Customs Enforcement, and the U.S. Customs and Border Protection took over its duties. Statistics have improved over time, and today, the Department of Homeland Security publishes its Yearbook of Immigration Statistics with information on immigrants from all countries, not just a select few.
Ultimately, the Census Bureau collects the statistics that it deems relevant for a particular year, which means that they change over time and are not necessarily the same as statistics that are collected by other federal agencies. While the historical statistics are lacking, a great many statistics are available today to reflect the great diversity of the Asian Pacific Islander Desi American community.
Footnotes
- An Act To limit the immigration of aliens into the United States, and for other purposes, Public Law 139, U.S. Statutes at Large 43 (1924): 153.
- An Act to execute certain treaty stipulations relating to Chinese, U.S. Statutes at Large 22 (1882): 58; An Act to repeal the Chinese Exclusion Acts, to establish quotas, and for other purposes, Public Law 199, U.S. Statutes at Large 57 (1943): 600; An Act To regulate the immigration of aliens to, and the residence of aliens in, the United States, Public Law 301, U.S. Statutes at Large 39 (1917): 874.
- An Act To authorize for a limited period of time the admission into the United States of certain European displaced persons for permanent residence, and for other purposes, Public Law 774, U.S. Statutes at Large 62 (1948): 1009; An Act To revise the laws relating to immigration, naturalization, and nationality; and for other purposes, Public Law 414, U.S. Statutes at Large 66 (1952): 163; An Act To amend the Immigration and Nationality Act, and for other purposes, Public Law 89-236, U.S. Statutes at Large 79 (1965): 911.
- Asian Pacific Institute on Gender-Based Violence, “Census Data and API Identities,” https://www.api-gbv.org/resources/census-data-api-identities/.
- United States Census Bureau, “About the Topic of Race,” last modified 1 March 2022, https://www.census.gov/topics/population/race/about.html.
- Campbell Gibson and Kay Jung, “Historical Census Statistics on Population Totals by Race, 1790 to 1990, and by Hispanic Origin, 1970 to 1990, for the United States, Regions, Divisions, and States,” Population Division Working Paper No. 56, (Washington, DC: U.S. Census Bureau, September 2002). Available online: https://www.census.gov/content/dam/Census/library/working-papers/2002/demo/POP-twps0056.pdf. Official reports are available from the United States Census Bureau, “Decennial Census Official Publications” page: https://www.census.gov/programs-surveys/decennial-census/decade/decennial-publications.html.
- United States Bureau of the Census, United States Census of Population: 1950, Census Tract Statistics Norfolk Virginia and Adjacent Area: Selected Population and Housing Characteristics (Washington, DC: US Government Printing Office, 1952); United States Bureau of the Census, United States Census of Population: 1950, Census Tract Statistics Richmond Virginia and Adjacent Area: Selected Population and Housing Characteristics (Washington, DC: US Government Printing Office, 1952). Available online: https://1950census.archives.gov/howto/statistical-data.html.
- An Act regulating passenger ships and vessels (a), Public Law 15-46, U.S. Statutes at Large 3 (1819): 489; Historical Statistics of the United States: Colonial Times to 1970, Part 1, Bicentennial Edition (Washington, DC: U.S. Department of Commerce, Bureau of the Census, 1975), 99. Available online: https://www.census.gov/library/publications/1975/compendia/hist_stats_colonial-1970.html.
- Historical Statistics of the United States: Colonial Times to 1970, Part 1, Bicentennial Edition (Washington, DC: U.S. Department of Commerce, Bureau of the Census, 1975), 99. Available online: https://www.census.gov/library/publications/1975/compendia/hist_stats_colonial-1970.html.
- E.P. Hutchinson, “Notes on Immigration Statistics of the United States,” Journal of the American Statistical Association 53, no. 284 (December 1958): 966, 1012-1016, available online: https://www.jstor.org/stable/2281963?seq=1; An Act To establish the Department of Homeland Security, and for other purposes, Public Law 107-296, U.S. Statutes at Large 116 (2002): 2136.


