

As part of my training in spatial history at George Mason University, I have had a chance to become acquainted with open-source programs like QGIS, StoryMapsJS, and StoryTimelineJS. These are digital tools designed by spatial humanists to assist academic and public historians in visually presenting the historical narrative. Earlier this year, the Library of Virginia Foundation hosted two events for which historical maps were the focus, and I had the opportunity to georeference a few of the Library’s historical maps and overlay them with Open Street Map.
The manuscript Plan of operations at Craney Island, 1813 June 22 was acquired by the Library of Virginia in January 2015 because of the kind and generous donation of Carole and Marcus Weinstein. On pages 408-409 of the Journal of the House of Delegates of Virginia, 1848-1849, is a reference to a “rough drawing, sketched and coloured by George F. de la Roche, on the 23d of June, 1813, in the marquee of Major Faulkner, the commanding officer of artillery, the day after the action, exhibiting a general view of the topography of the country, and of the position of the American and British forces and shipping, which…document that gentleman…has kindly presented to the state librarian, to be preserved in the public library of the commonwealth.” The sketch is not listed in the library’s catalog for 1849, and it appears that the title and de la Roche’s name were penciled on the map at a later date, but it is possible that this map is the one referenced in the Journal.

Plan of operations at Craney Island, 22 June 1813, by George Francis de la Roche
Map Collection, Special Collections, Library of Virginia.
Today, Craney Island is a naval supply center and the area’s topography has changed.
I was able to georeference the manuscript map at 300 dots per inch (dpi). What does it mean to georeference a map? This is a process through which a raster image is aligned with a projection, and control points are added that link known data raster datasets with known positions or map coordinates. Once the historical map has been georeferenced, researchers can view the map layers: a manuscript 19th-century map layered with Open Street Map.

Craney Island Open Street Map

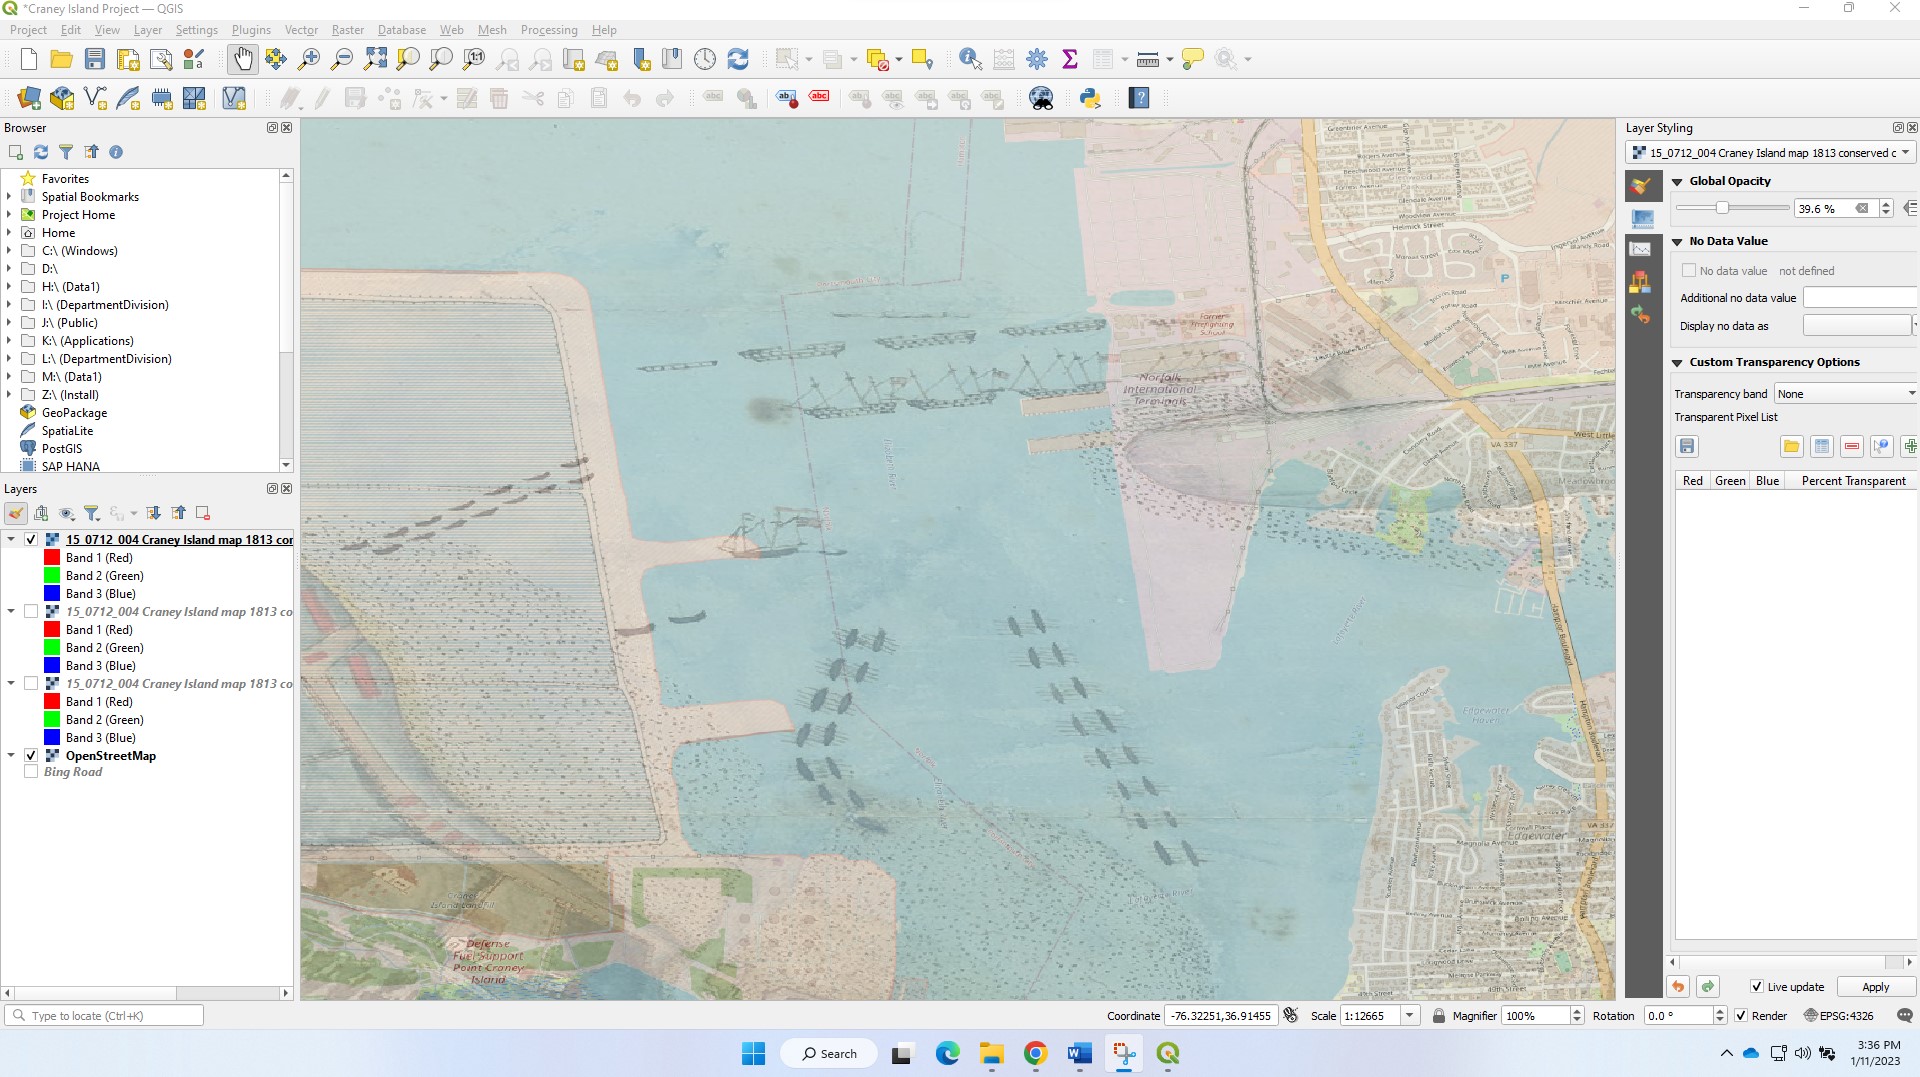
Craney Island overlay

Craney Island overlay (zoomed in)

Google Maps rendering of modern-day Craney Island
The overlays provide viewers with a peek into what the island looked like before Norfolk’s massive population growth and development during the 20th century.
Richmond’s history is rich with multiple layers and one map provides unique insight to the city’s Civil War experiences. Charles Ludwig’s engraved Map of a part of the city of Richmond showing the burnt districts was published by William Ira Smith, proprietor, Richmond Whig, shortly after the destructive fire of April 1865. Ludwig’s map shows the area north of the James River surrounding the Capitol and includes street names. The city blocks align well with present-day streets.

``Map of a part of the city of Richmond showing the burnt districts,`` C.L. Ludwig, ca. 1865

Richmond City Open Street Map
The georeferenced copy of Ludwig’s map layered over Open Street Map in QGIS (below) shows where the burnt district was located in present-day Richmond.


What is particularly revealing is the changes that the interstate and expressways have made to the city. In the image below, I’ve lowered the opacity to better show these changes. At some point we will be adding other maps of Richmond to document the city’s changing landscape.

To better identify important locations mentioned in writing on the Library’s copy of Ludwig’s map, I was able to create another layer using circles to identify their locations (see below).

Fortunately, maps created in QGIS can be published and a dedicated team of scholars maintain it. Instructions and user aides have been published by the Programming Historian. As 2023 continues, we will be georeferencing other historical maps and hope to make them available for researchers to use.


